

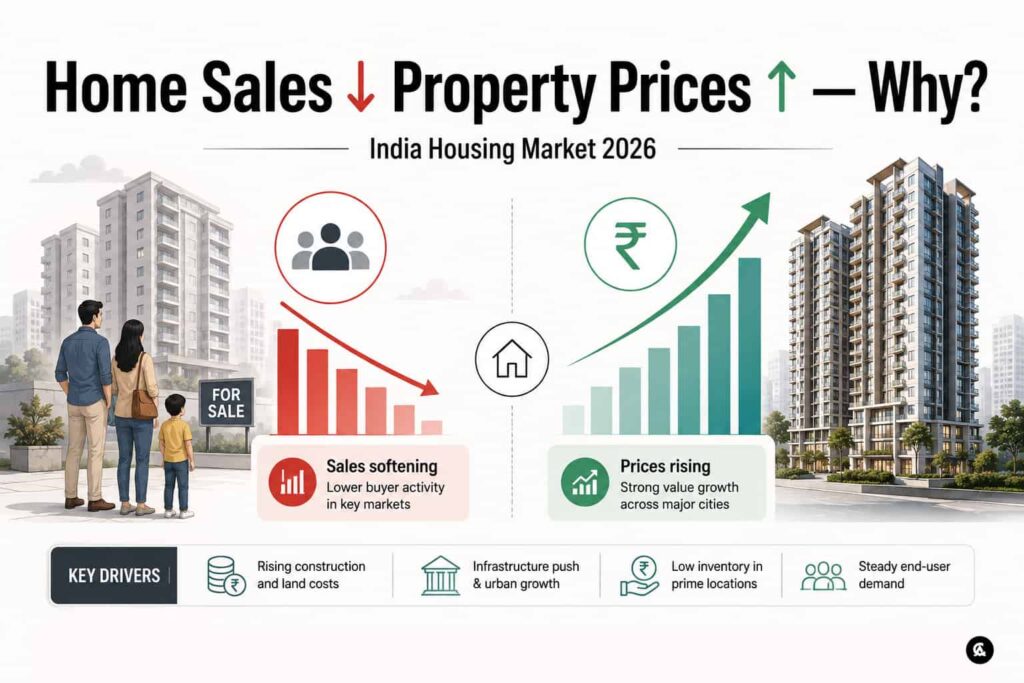
India’s residential market is showing an unusual combination in 2026: housing sales have softened in one major industry dataset, available inventory has increased, yet property prices continue to rise.
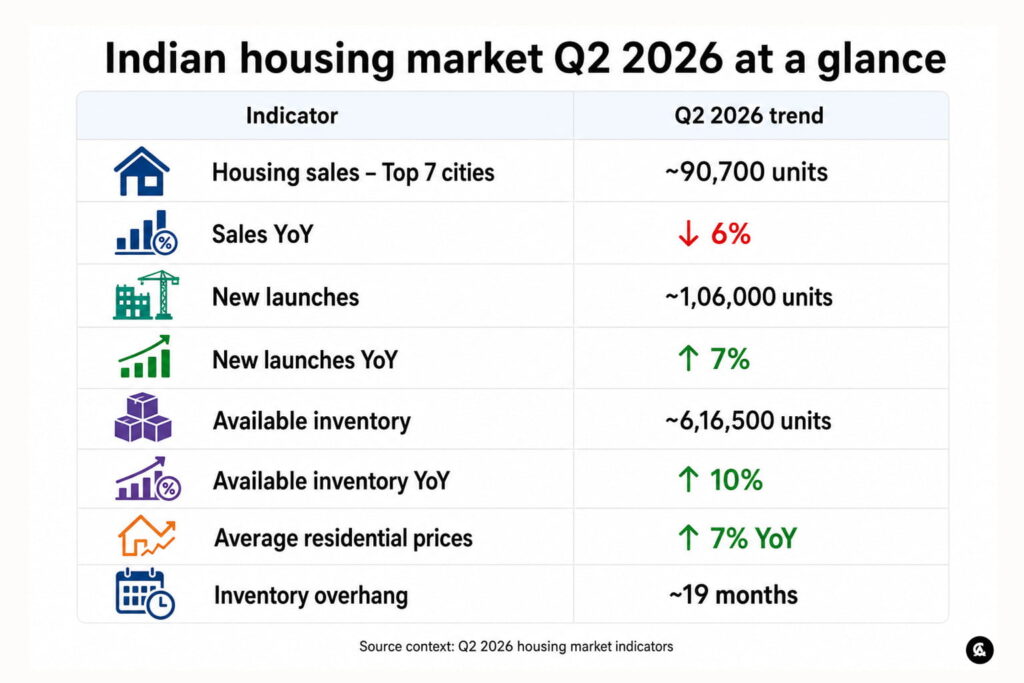
ANAROCK’s Q2 2026 residential report shows that sales across India’s top seven cities declined 6% year-on-year to about 90,700 units, while average residential prices increased 7% year-on-year. New launches, meanwhile, rose 7% annually to around 1.06 lakh units.
For homebuyers, this creates an obvious question:
If fewer homes are being sold, why aren’t property prices falling?
The answer lies in a combination of premium housing, developer pricing strategies, supply patterns, rising costs and highly localised demand. More importantly, falling sales alone are not enough to trigger a property price correction.
Indian housing market Q2 2026 at a glance
| Indicator | Q2 2026 trend |
|---|---|
| Housing sales – Top 7 cities | ~90,700 units |
| Sales YoY | ↓ 6% |
| New launches | ~1,06,000 units |
| New launches YoY | ↑ 7% |
| Available inventory | ~6,16,500 units |
| Available inventory YoY | ↑ 10% |
| Average residential prices | ↑ 7% YoY |
| Inventory overhang | ~19 months |
ANAROCK defines its pan-India market in this report as the top seven cities: NCR, MMR, Bengaluru, Pune, Hyderabad, Chennai and Kolkata. Its average-price figure refers to quoted base selling prices on super built-up area, not the transaction price of every individual property.
That distinction matters. A 7% increase in the market average does not mean every home in these cities became 7% more expensive.
Why are property prices rising even when home sales are slowing?
The first reason is that sales volume and property prices do not always move together immediately.
Developers can sell fewer units without reducing headline prices if demand remains adequate in their target segment, inventory is manageable in the relevant micro-market, or the projects being launched are increasingly premium.
ANAROCK says residential prices across the top seven cities increased 7% annually and 1% quarter-on-quarter in Q2 2026, supported by end-user demand, disciplined supply and the ability of developers to maintain pricing.
CBRE describes the market differently but reaches a similar structural observation. Its Q2 2026 residential monitor says sales volumes rationalised during the quarter while the share of high-end apartment sales continued to increase, with developers introducing about 63,800 units.
This suggests that the current market is not simply experiencing a demand collapse. It is also undergoing a change in what type of housing is being built and sold.
Is premium housing keeping average property prices high?
Premiumisation is one of the most important factors shaping the Indian real estate market in 2026.
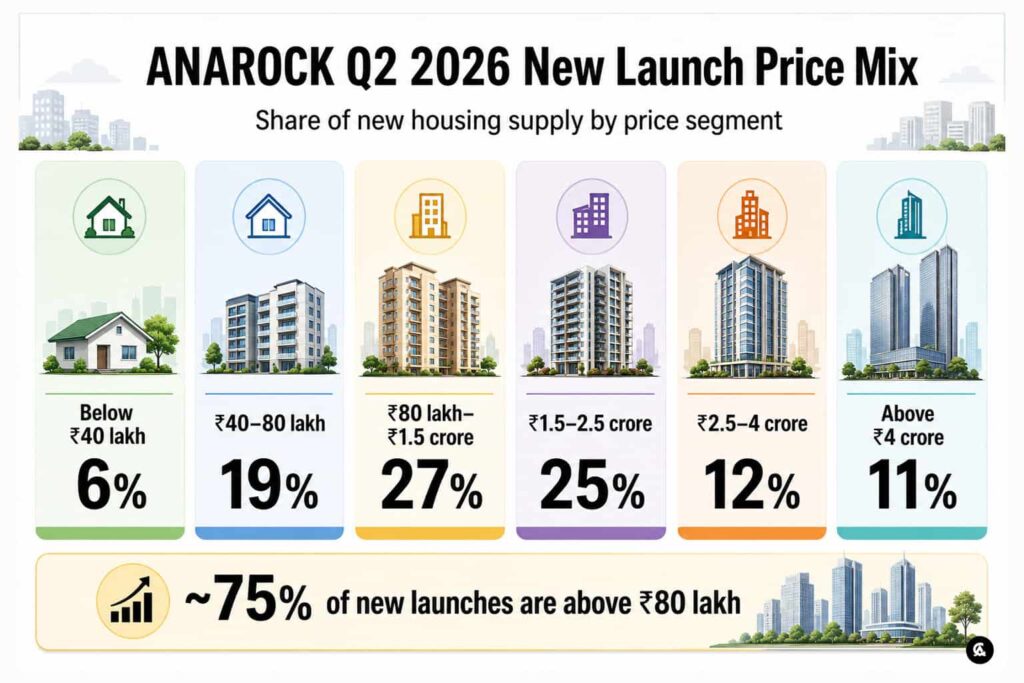
ANAROCK’s Q2 launch data shows:
| New launch price segment | Share |
| Below ₹40 lakh | 6% |
| ₹40–80 lakh | 19% |
| ₹80 lakh–₹1.5 crore | 27% |
| ₹1.5–2.5 crore | 25% |
| ₹2.5–4 crore | 12% |
| Above ₹4 crore | 11% |
Homes costing more than ₹80 lakh accounted for roughly three-fourths of new launches, while homes below ₹40 lakh represented only 6%. Homes above ₹1.5 crore alone accounted for approximately 48% of new supply.
This matters because a residential market increasingly dominated by ₹1 crore, ₹2 crore and ₹5 crore properties can maintain high average price levels even while some price-sensitive buyers postpone purchases.
CBRE’s 2026 residential outlook also identifies a continuing flight-to-quality, with high-end housing expanding its share across major cities.
Are property prices really rising everywhere?
No.
A national or top-seven-city average should never be treated as the appreciation rate of an individual property.
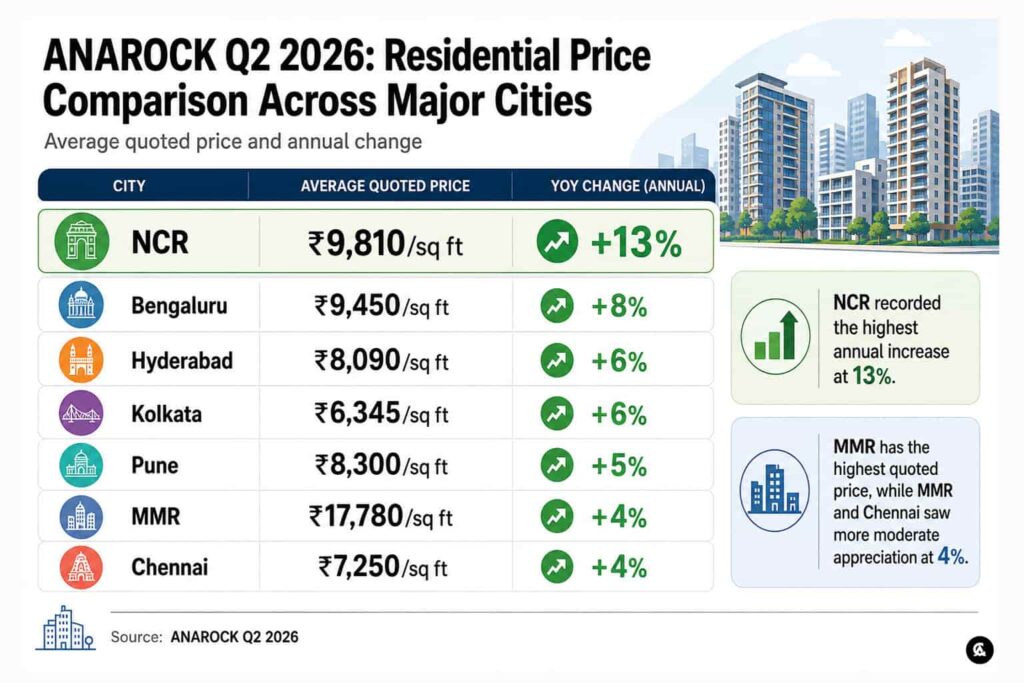
ANAROCK’s Q2 2026 data shows significant differences between cities:
| Market | Average quoted price | YoY change |
| NCR | ₹9,810/sq ft | +13% |
| Bengaluru | ₹9,450/sq ft | +8% |
| Hyderabad | ₹8,090/sq ft | +6% |
| Kolkata | ₹6,345/sq ft | +6% |
| Pune | ₹8,300/sq ft | +5% |
| MMR | ₹17,780/sq ft | +4% |
| Chennai | ₹7,250/sq ft | +4% |
NCR recorded the strongest annual increase at 13%, while MMR and Chennai recorded much more moderate appreciation.
Even within one city, two micro-markets can behave very differently.
Property appreciation depends on factors such as:
- Location and connectivity
- Infrastructure completion
- Developer reputation
- Available competing supply
- Project construction stage
- Plot or apartment configuration
- Employment catchment
- Local resale inventory
A city-level price index is therefore useful for understanding direction, but it should not be used to value a specific apartment.

NCR case study: Sales down, launches down, but prices up
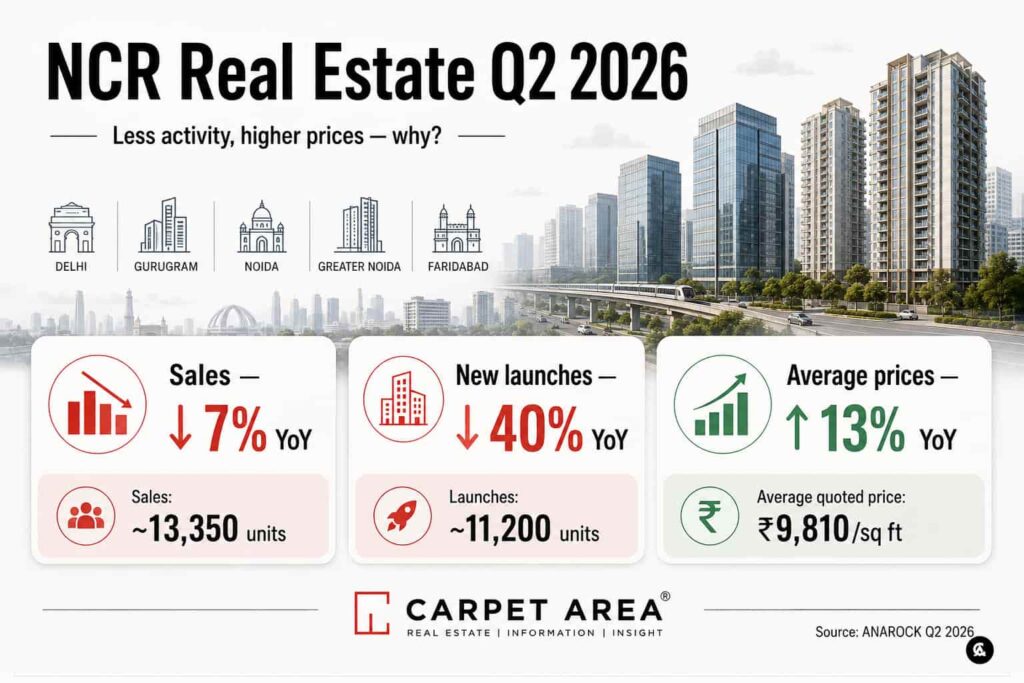
NCR presents perhaps the clearest example of the current contradiction.
According to ANAROCK:
Q2 2026 sales: ~13,350 units
Sales YoY: ↓ 7%
Q2 2026 launches: ~11,200 units
Launches YoY: ↓ 40%
Average quoted price: ₹9,810/sq ft
Price YoY: ↑ 13%
So NCR simultaneously experienced fewer launches, lower sales volume and significantly higher quoted prices.
JLL’s separate Delhi-NCR research also shows moderation, although its methodology produces different numbers: residential sales declined 9% YoY, launches fell 16% YoY, while capital values and rents continued to grow.
This is an important clue.
When fresh supply contracts sharply, slower sales do not automatically create a glut of newly launched homes. In selected locations, constrained supply can help existing projects maintain pricing.
What does Bengaluru tell us about the same trend?
Bengaluru provides another useful example.
JLL reports that Q2 2026 residential demand declined approximately 6% quarter-on-quarter to around 17,000 units, while property prices increased 3.1% quarter-on-quarter. Residential launches were also down 20% from the previous quarter.
Different markets therefore show the same broad possibility:
Transaction momentum can soften without an immediate fall in property values.
This is why buyers should avoid assuming that lower quarterly sales automatically mean builders will cut prices in the next quarter.
Why don’t developers simply cut prices to sell more homes?
Developers have several alternatives before reducing the published base price of a project.
They may:
- Slow new launches
- Release inventory in phases
- Change payment plans
- Offer limited-period incentives
- Waive selected charges
- Negotiate selectively on individual units
- Focus marketing on better-performing configurations
There is another constraint: development cost.
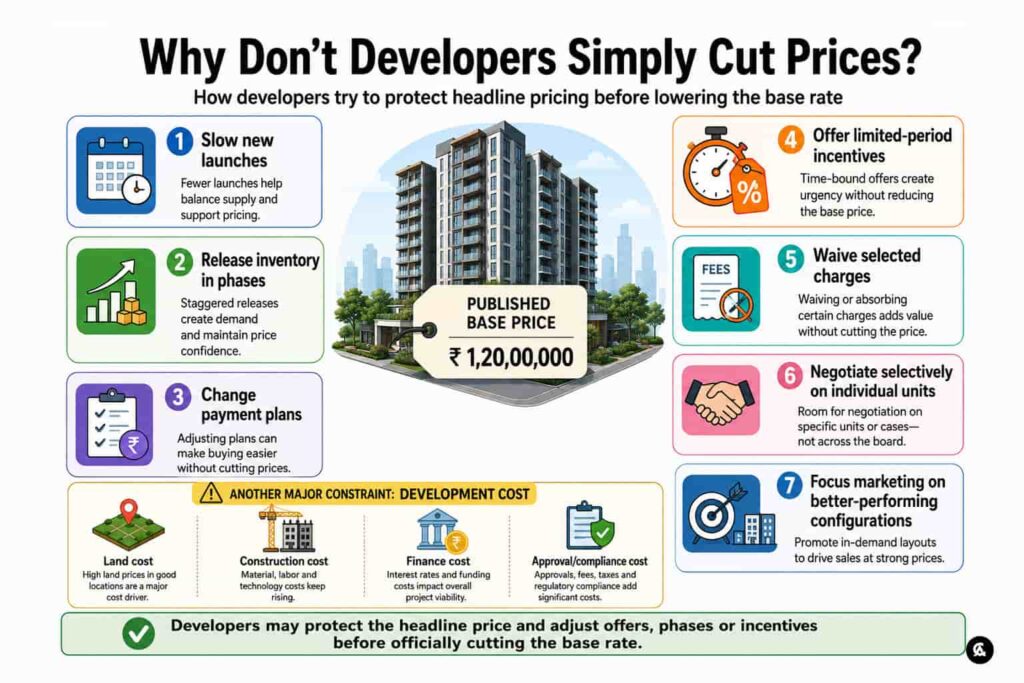
ANAROCK specifically identifies rising land and construction costs as one reason entry-level housing has become less viable for developers compared with higher-margin premium projects.
Therefore, even when demand weakens, the developer may not have enough room—or incentive—to make a large reduction in the project’s headline price.
This does not mean discounts are unavailable.
It means a market correction may first appear through effective deal prices and incentives rather than a visible cut in the advertised rate.
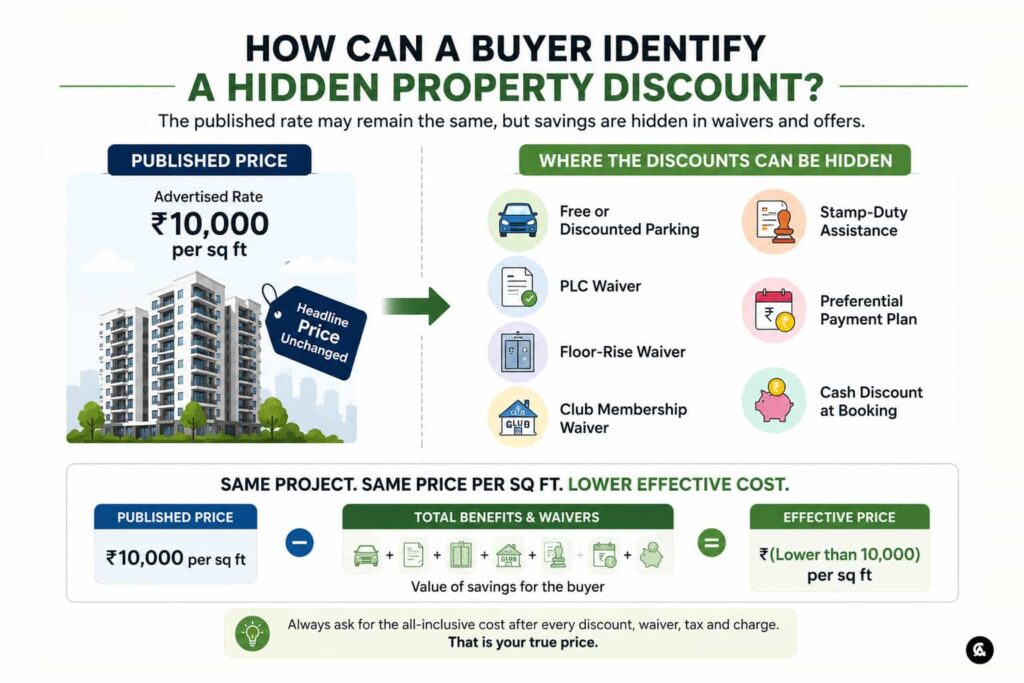
How can a buyer identify a hidden property discount?
Suppose a project continues advertising at ₹10,000 per sq ft.
The developer may still offer:
Free or discounted parking
PLC waiver
Floor-rise waiver
Club membership waiver
Stamp-duty assistance
Preferential payment plan
Cash discount at booking
The published rate may therefore remain unchanged while the effective acquisition cost falls.
For buyers, the better question is not:
“Has the builder reduced the price per sq ft?”
It is:
“What is my final all-inclusive cost after every discount, waiver, tax and charge?”
That number allows meaningful comparison between competing projects.
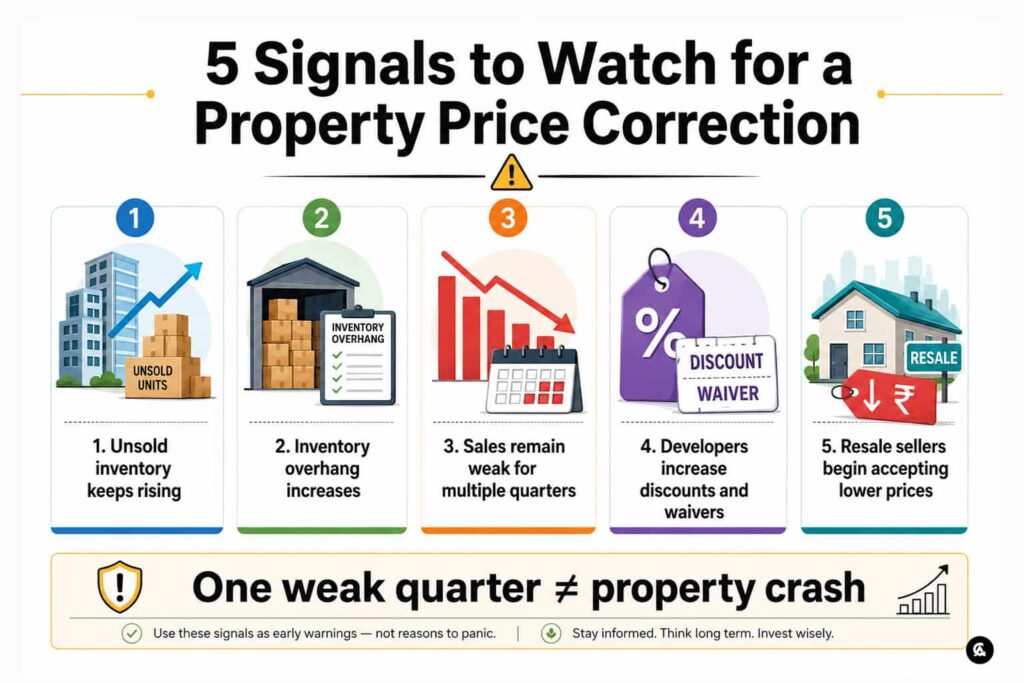
Is rising unsold inventory a warning sign?
This is one metric homebuyers and investors should watch closely.
ANAROCK estimates that available housing inventory across the top seven cities reached approximately 6,16,500 units at the end of Q2 2026, up 10% year-on-year.
Inventory overhang—the estimated time required to sell existing stock at the prevailing sales pace—rose to around 19 months, compared with roughly 18 months in Q1 2026.
ANAROCK notes that new supply has been outpacing absorption over successive quarters.
That does not establish that a price crash has started.
But if the following combination continues for several quarters:
Inventory ↑
Inventory overhang ↑
Sales ↓
Developer incentives ↑
then buyers would have stronger evidence that negotiating power is shifting toward them.
Does a 7% property-price increase matter much to a homebuyer?
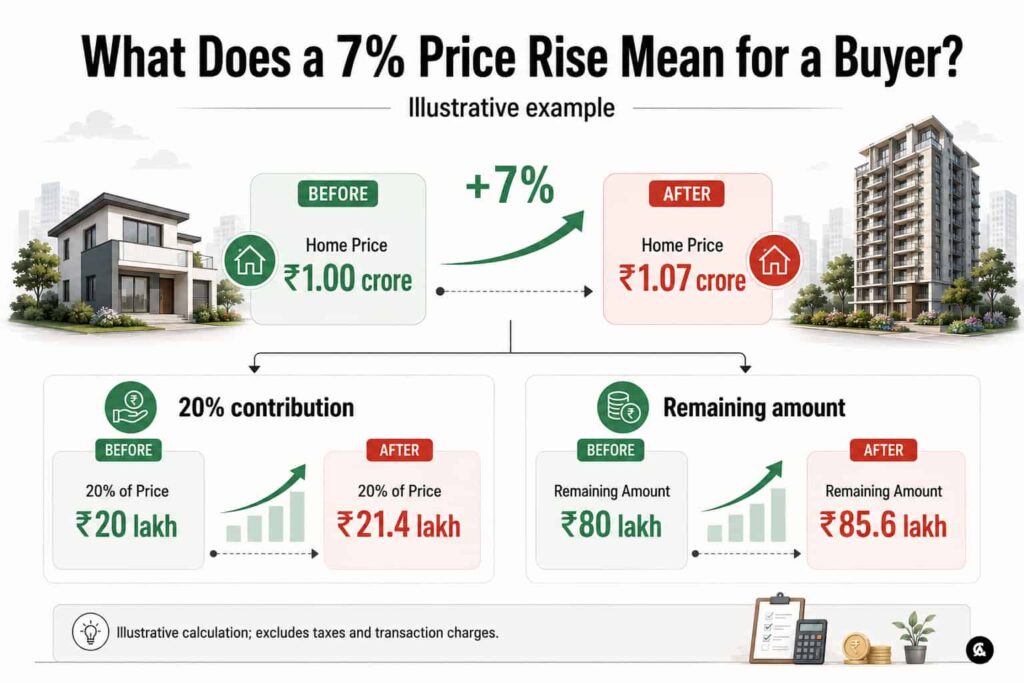
Consider a simple illustration.
Assume a home costs ₹1 crore and genuinely appreciates by 7%.
Its price becomes:
₹1.07 crore
If the buyer funds 20% through their own contribution:
| ₹1 crore home | ₹1.07 crore home | |
| 20% contribution | ₹20 lakh | ₹21.4 lakh |
| Remaining 80% | ₹80 lakh | ₹85.6 lakh |
The buyer now needs an additional ₹1.4 lakh upfront and potentially ₹5.6 lakh more financing, even before considering stamp duty, registration, GST where applicable and other property charges.
This illustrates why apparently moderate annual property appreciation can quickly affect affordability.
Important clarification: Did home sales actually fall across India?
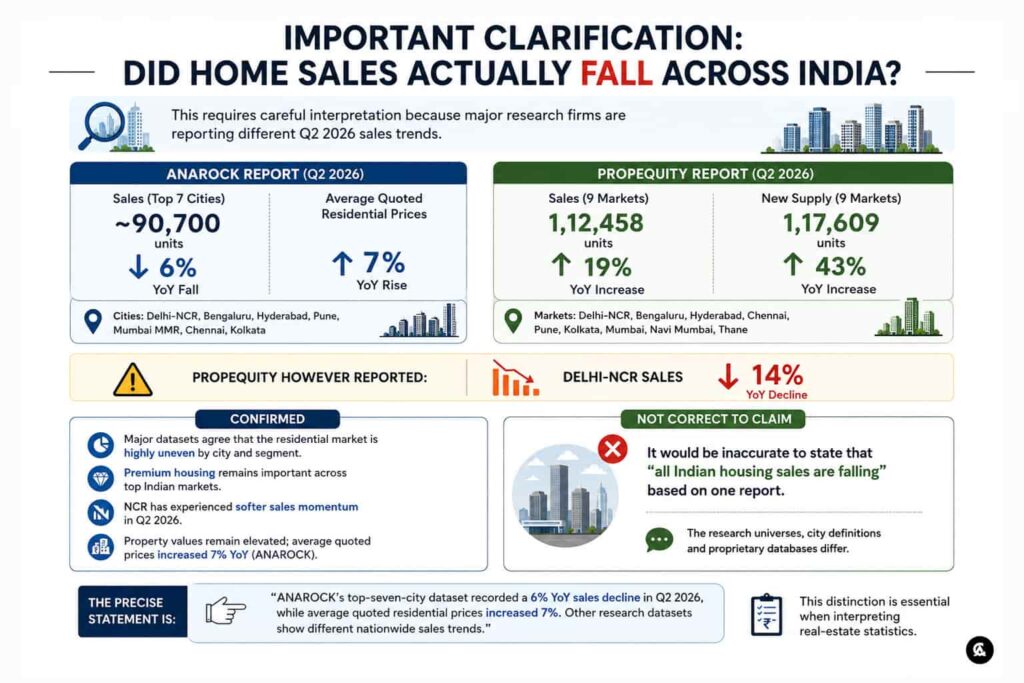
This requires careful interpretation because major research firms are reporting different Q2 2026 sales trends.
ANAROCK reports a 6% YoY fall to around 90,700 units across its top seven-city universe.
PropEquity, however, reported a 19% YoY increase to 1,12,458 units across nine markets, with new supply rising 43% to 1,17,609 units. Its study separately includes Mumbai, Navi Mumbai and Thane alongside Delhi-NCR, Bengaluru, Hyderabad, Chennai, Pune and Kolkata.
PropEquity nevertheless reported Delhi-NCR sales declining 14% YoY in its own dataset.
Confirmed
Major datasets agree that the residential market is highly uneven by city and segment, premium housing remains important, and NCR has experienced softer sales momentum while property values remain elevated.
Not correct to claim
It would be inaccurate to state that “all Indian housing sales are falling” based on one report.
The research universes, city definitions and proprietary databases differ.
The precise statement is:
ANAROCK’s top-seven-city dataset recorded a 6% YoY sales decline in Q2 2026, while average quoted residential prices increased 7%. Other research datasets show different nationwide sales trends.
This distinction is essential when interpreting real-estate statistics.
Are higher average prices partly a product-mix issue?
Possibly—and buyers should understand this before interpreting market averages.
If developers increasingly launch expensive homes, the composition of available housing changes.
For example, a market dominated previously by ₹60 lakh and ₹80 lakh homes will naturally look different when a greater proportion of launches cost ₹1.5 crore, ₹3 crore or more.
This does not mean the reported price appreciation is imaginary. It means average market prices and the appreciation of an identical property are different measurements.
For an actual buying decision, compare:
Same locality
Similar developer quality
Similar configuration
Similar construction stage
Similar floor/location
Previous transaction or launch price
That gives a more reliable picture of genuine like-for-like appreciation.
Will property prices crash if sales continue slowing?
The current data does not provide enough evidence to call a nationwide property crash.
ANAROCK itself describes the Q2 moderation as cyclical rather than structural. Its inventory overhang has risen to approximately 19 months but remains below the 25-plus-month levels seen in early 2022.
CBRE’s 2026 outlook expects unit sales to remain relatively range-bound while overall sales values stay elevated, supported partly by high-end housing and calibrated supply.
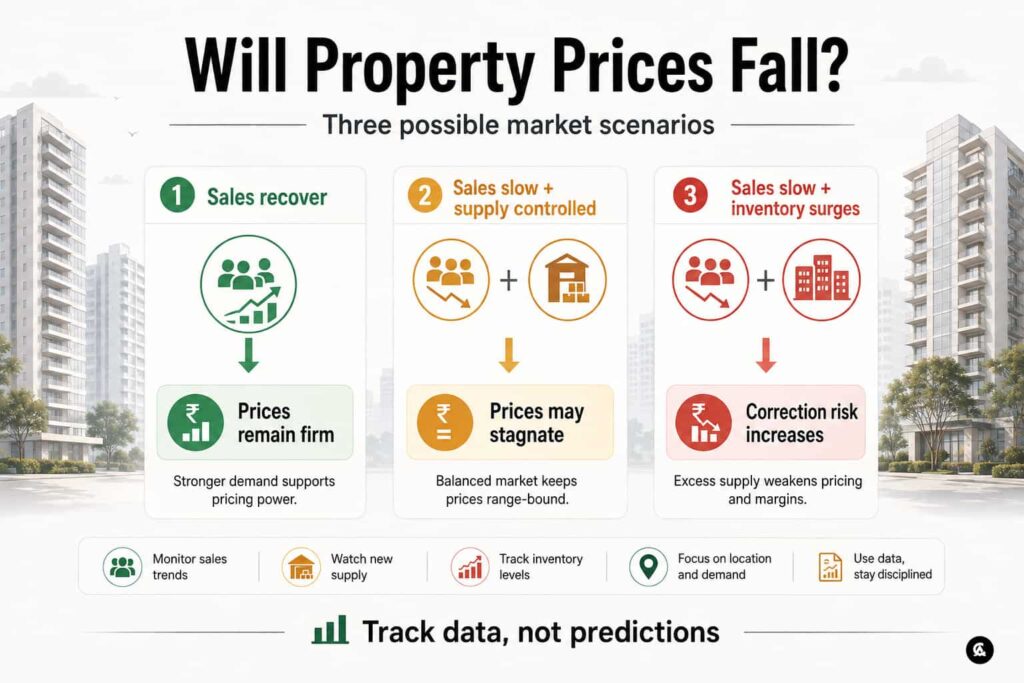
Three broad scenarios are more useful than predicting a crash:
Scenario 1: Sales recover
Demand strengthens and inventory is absorbed.
Likely effect: Prices can remain firm or continue rising selectively.
Scenario 2: Sales remain weak but developers control new supply
Developers slow launches and protect headline prices.
Likely effect: Prices may stagnate or grow slowly instead of falling sharply.
Scenario 3: Sales weaken and inventory keeps building
Unsold stock and overhang rise while developers and resale sellers begin competing aggressively.
Likely effect: Effective prices may soften and buyers gain stronger negotiating power.
Should homebuyers buy now or wait for a price correction?
There is no single answer for every buyer.
For an end-user, the property’s suitability, affordability, developer track record, location and expected holding period matter more than trying to identify the exact market bottom.
For an investor, entry valuation becomes more important. Compare rental yield, competing future supply, resale liquidity and expected infrastructure before assuming past appreciation will continue.
For a financially stretched buyer, rising prices should not create FOMO. A property is not affordable merely because prices may increase further.
The most important question is not:
“Will prices rise next year?”
It is:
“Can I comfortably own this particular property at today’s all-inclusive cost?”
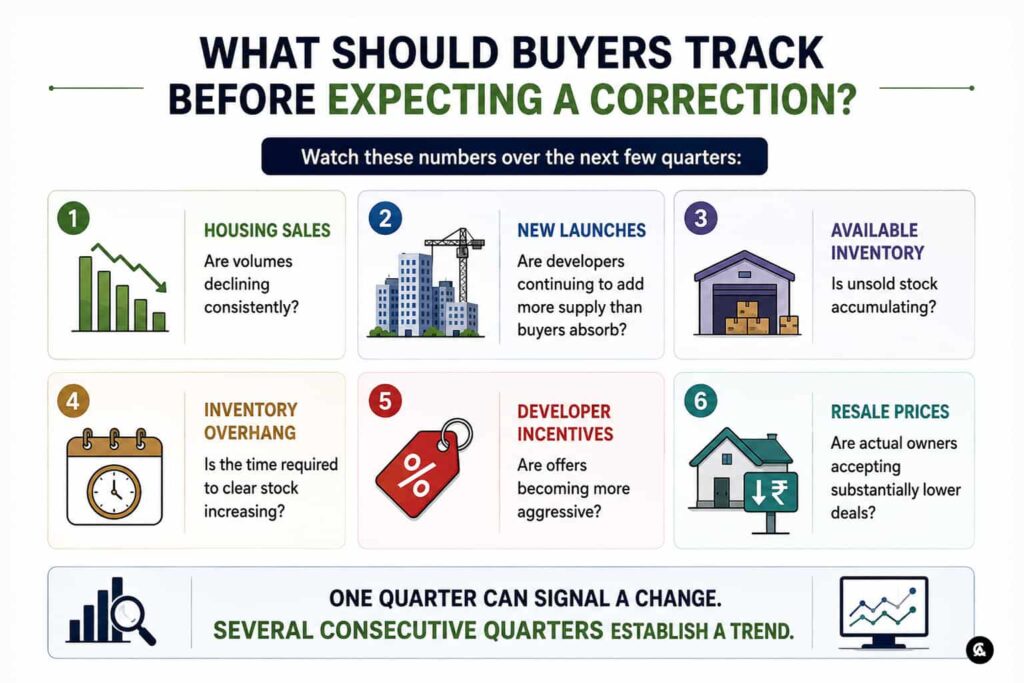
What should buyers track before expecting a correction?
Watch these numbers over the next few quarters:
Housing sales — Are volumes declining consistently?
New launches — Are developers continuing to add more supply than buyers absorb?
Available inventory — Is unsold stock accumulating?
Inventory overhang — Is the time required to clear stock increasing?
Developer incentives — Are offers becoming more aggressive?
Resale prices — Are actual owners accepting substantially lower deals?
One quarter can signal a change. Several consecutive quarters establish a trend.
What homebuyers should know?
The property prices in India 2026 story is more complex than “demand is down” or “prices will keep rising”.
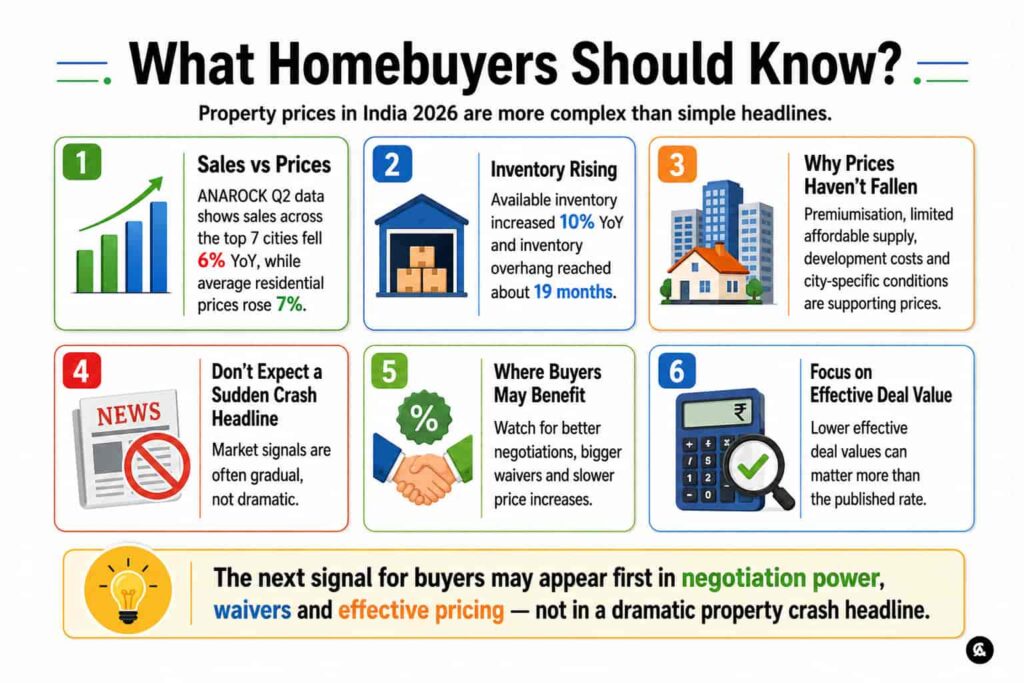
ANAROCK’s Q2 data shows a clear contradiction: sales across its top seven cities fell 6% YoY while average residential prices rose 7%. At the same time, available inventory increased 10% and inventory overhang reached around 19 months.
Premiumisation, constrained affordable supply, development costs and city-specific supply conditions are helping explain why prices have not followed sales lower.
But rising inventory also deserves attention.
For buyers, the next signal may not be a dramatic newspaper headline announcing a property crash. It could appear first as better negotiations, larger waivers, slower price increases and lower effective deal values.
That is where homebuyers should look.
Sources:-
ANAROCK — Residential Market Viewpoints, Pan India, Q2 2026
Primary source for top-seven-city sales, launches, available inventory, price movement, inventory overhang and launch-price segmentation. ANAROCK Q2 2026 Residential Market Viewpoints
JLL — Delhi Mass Residential Market Dynamics Q2 2026
Delhi-NCR sales, launches, capital-value and rental trends. JLL Delhi-NCR Residential Q2 2026
JLL — Bengaluru Mass Residential Market Dynamics Q2 2026
Bengaluru sales, launches and quarterly property-price movement. JLL Bengaluru Residential Q2 2026
CBRE — India Market Monitor Q2 2026, Residential
Residential sales normalisation, new supply and increasing high-end housing share. CBRE India Market Monitor Q2 2026
CBRE — India Residential Market Outlook 2026
Market equilibrium, premium housing, affordability and residential-market outlook. CBRE India Residential Market Outlook 2026
PropEquity — Q2 2026 housing-market data, reported by Business Standard
Used to explain why different industry datasets show different overall sales trends. Business Standard — PropEquity Q2 2026 Housing Sales Data





Leave a Reply